LOLA - Documentation
1. Generate Input Files
Generate a sequence and an entry positions file (both in simple txt format). The Sequence File contains the DNA sequence you want to analyze (only A, T, C, G allowed - no line breaks, no lowercase, no 'N's etc.). The Positions File is a list of the genome positions from where sequence fragments will be extracted (numbers, each followed by a line break).
Sequence File example
GACTTCTATCATCTTTCACTTCCACTCCCTATTCAGAATCATTCACAATTACATTTCAAGGACTTCTATCAT
CTTTCACTTCCACTCCCTATTCAGAATCATTCACAATTACATTTCAAGGACTTCTATCATCTTTCACTTCCA
CTCCCTATTCAGAATCATTCACAATTACATTTCAAGGACTTCTATCATCTTTCACTTCCACTCCCTATTCAG
AATCATTCACAATTACATTTCAAGGACTTCTATCATCTTTCACTTCCACTCCCTATTCAGAATCATTCACAA
Positions File example
1
17
122
3
3456
8
2. Load Input Files
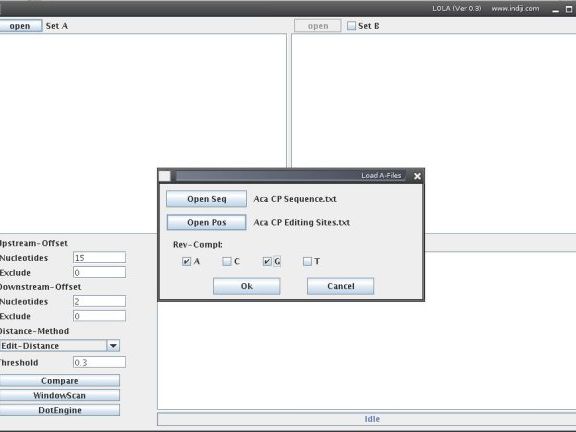
Now, open LOLA and open your Sequence and Position Files as set A. In the Load Files window you can choose if fragments shall be extracted as reverse complement if a certain nucleotide is found at a position specified in the Positions File. For example, if you want to analyze the regions arounf C-to-U RNA editing sites (editing sites would be the coordinates in the Positions File), you would tick the G-box. Or, if you want to analyze the regions around the 'A' of 'ATG' start codons (start of coding sequences would be the coordinates in the Positions File), you would select 'T'. If you want to compare your set A with another set of sequence fragments, tick the Set B field and open a second file set in the same way.
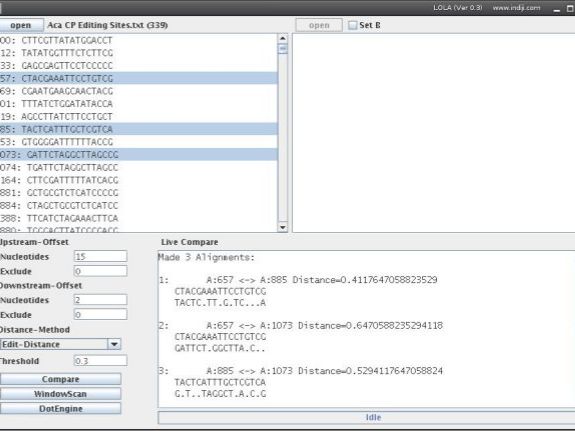
Now you should see the sequence segments extracted from the Sequence File at all positions as specified in the Positions File. You can select two or more fragments by holding down the 'ctrl'-key and clicking on the list. All possible pairwise comparisons between the selected sequence segments will be shown in the bottom-right-corner.
3. Select Sequence Extraction Parameters
Upstream-Offset
Nucleotides: Nucleotides upstream of position to extract (negative values possible)
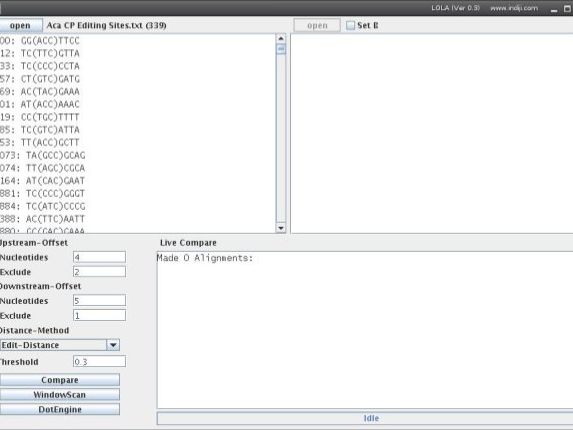
Exclusion: Nucleotides upstream of position to be omitted from subsequent analysis (will not be deleted but won't be scored in comparisons and are indicated by brackets.)
Downstream-Offset
Nucleotides: Nucleotides downstream (1 is the entry position, 2 is the entry position and the first nucleotide downstream) to extract (negative values possible)
Exclusion: Nucleotides downstream of position to be omitted from subsequent analysis (will not be deleted but won't be scored in comparisons and are indicated by brackets.)
Distance-Method
Elementwise: Compares the sequence segments nucleotide per nucleotide
Edit-Distance: Counts the minimal number of modifications (point mutations, insertions or deletions) which are required to make the two sequences identical.
Threshold: Elementwise: differences (0 = identical);
Edit-Distance: number of modification steps / length of fragment
Note: Press Enter after changing a parameter!
4. Sequence Comparison
Then you can press 'compare' to pairwise compare all sequence segments. If only Set A is activated, all fragments of Set A will be compared. If Set B is activated, all segments from Set A will be with compared with all segments from Set B. Dots in the output represent nucleotides identical in both sequences in a pairwise alignment.
Note that the alignment ignores insertions or deletions used by the Edit-Distance mode. This is shown in the example on the right: All three sequence sets have the same Edit-Distance (3 edits in 17 bases = 3/17 = 0.18). Sets '1.' and '2.' align well but Set '2.' doesn't, because the sequences are shifted by one base. Thus, when working in Edit-Distance mode, please work with the values and ignore the aligments.
1. 13200<->71579 =>0.17647058823529413 TAAAGTTG(AGT)AATTATTAG
.G....AC(.A.).........
2. 10065<->10066 =>0.17647058823529413 AGTGTCAG(ATT)TTTAGGGAC
GTGTCAGA(T..)..AG..ACA
3. 15765<->130014 =>0.17647058823529413 ATGATGTT(TTC)AGGACTATT
.....T..(...)....A..G.
5. Window-Scanning
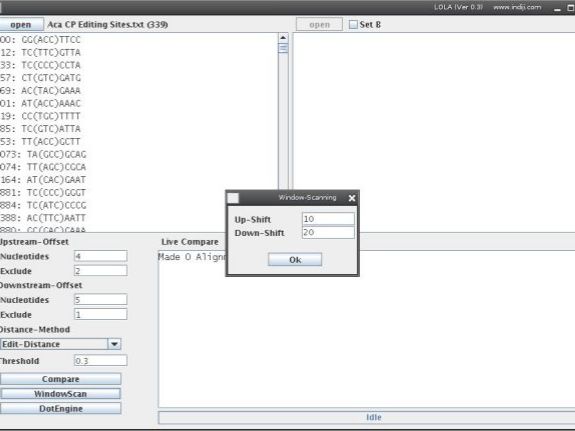
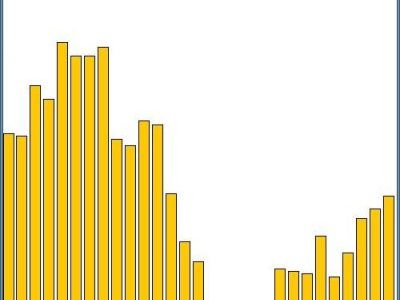
The Window-Scannig function runs a window of a size defined by your upstream and downstream values along all possible sequence pairs. After pressing WindowScan you will be asked where the window should start and stop. The Window moves in one nucleotide steps and counts the number of sequence pairs which exceed the threshold at each position. This function can be used to detect if your sequence segments contain sequence elements which occur at the same or similar position but are different in sequence for subsets of sequence segments.
Notes:
- Window-Scanning works only for Set A.
- If the graphical output window appears white enlarge it to full screen.
- You can copy the values from the output window to Excel to prepare your own custom diagram.
The result is a text-output containing a list of rows, each representing the compare-process for a combination of up-/down-stream-values and the number of pairs found which distance is lesser or equal to the threshold
UpStream DownStream Count
12 -6 3869
11 -5 3864
10 -4 4020
9 -3 3977
8 1 4156
7 2 4115
6 3 4115
etc. etc. etc.
Note that excluded positions (see above) are also omitted in the Window Scan (here -2, -1 and 0).
6. DotEngine Visualization
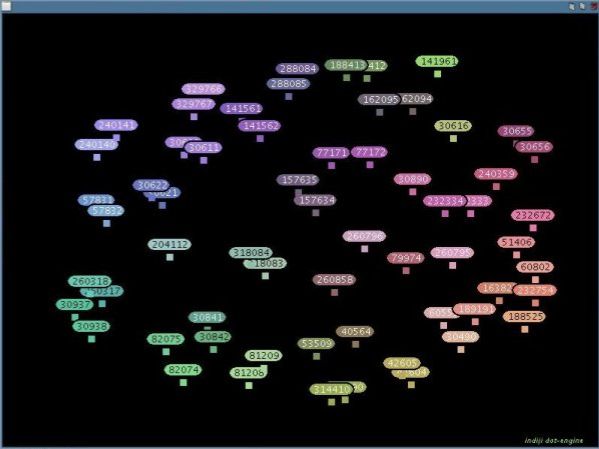
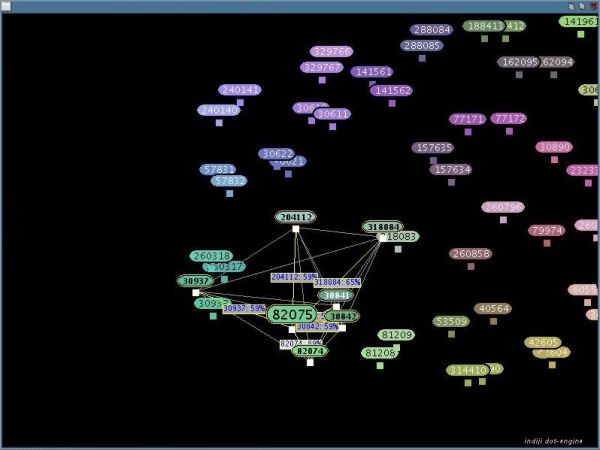
The DotEngine visualizes the relationships between the sequence pairs which exceeded the threshold in your comparison. This can be used to identify subgroups of sequences which are similar to each other but different to the other sequences. Note: DotEngine works only for internal comparison in Set A. Press the button 'DotEngine'. All sequence fragments with a pairwise distance lesser or equal to the threshold-value will be added to the DotEngine-Graph and be arranged and colored according to their distances. Similar sequence fragments will be drawn near to each other and have a similar color.
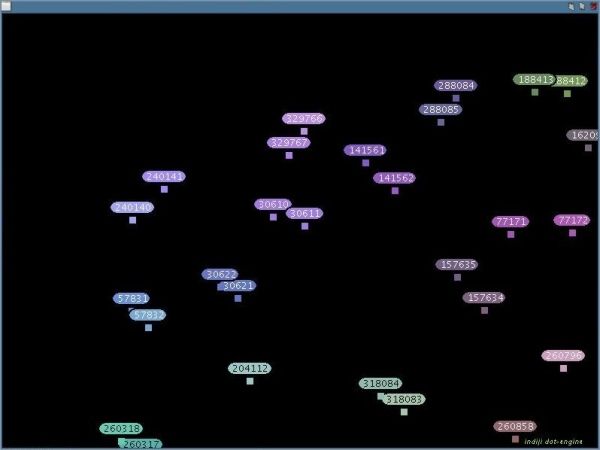
Use the mouse wheel to zoom in and out
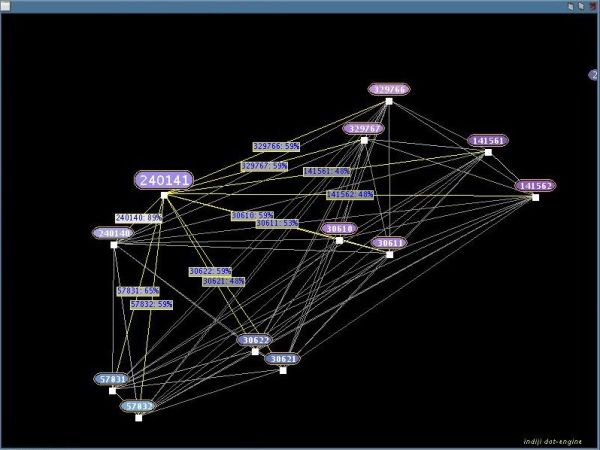
Hold down the left mouse button and drag a rectangle to select sequence fragments. If you move the mouse cursor over a selected sequence fragment its distances to every other selected sequence fragment will be shown:
You can also hold down the right mouse button on a sequence fragment and use the mouse wheel to select or deselect the most similar sequence fragment (still the Elementwise-/Edit-Distance):
