.OGDRAW - Frequently Asked Questions
-
Why do I see a giant gene that extends across half of the map?
-
Some of the gene names are extremely long and overlap with the GC graph or the image border. How can I avoid this?
-
Some of the gene names are scrambled after activating the "tidy up" option. Why?
-
I need a different resolution of the final image. What can I do?
-
How can I import OGDRAW-generated maps into CorelDraw?
-
I would like to change certain names and/or edit features on the map. How can I do this?
-
Which GenBank tags are used to label drawn features?
-
How are operons identifed by OGDRAW?
-
I uploaded my favourite plasmid construct to draw a nice map and it looks ugly.
-
Some gene names seem to be duplicated and/or gene boxes are overlapping or covered with genes classified as "other genes". What's the matter here?
-
How do I create a custom configuration file?
-
All intron-containing genes are fragmented into their exons and the exons are displayed as seperate features on the map. Why is that and how can I solve this problem?
-
How do I use OGDRAW for heat maps?
1. Why do I see a giant gene that extends across half of the map?
There are several possible reasons for this: It could come from the way trans-spliced genes are annotated in most of the organellar genome sequences deposited in the GenBank database. To the program they appear as large genes encompassing the whole sequence range between the trans-spliced exons. If you did not activate the '"tidy up" option, the program will display a giant gene - if you activate it, giant genes will be analysed and split into their individual parts (provided that these are properly annotated). A second possible reason is simply a wrong annotation in the GenBank file/entry. Sometimes the files contain mistakes, but activating "tidy up" will filter out all genes that are longer than 10 kb. See answer 2 for how to correct annotation errors in GenBank files.
2. Some of the gene names are extremely long and overlap with the GC graph or the image border. How can I avoid this?
This problem occurs when genes names are not formulated according to the naming guidelines that we propose. Switching on the "tidy up" option should reformat most of the tRNA and rRNA names to produce the shortest possible gene name (that still contains all necessary information). If the gene name is still too long after activating "tidy up", you either found a bug or your GenBank entry contains a gene, in which the name is not specified in the field designated to contain the name. The program searches for a gene name in the different tags that a GenBank feature can have. The order in which the program proceeds is: "gene" -> "label" -> "note" -> "locus_tag" -> "product" -> "operon" . If a feature does not possess any of these tags the name will be displayed as "N/D". To solve the problem with overly long names, we recommend that you download the GenBank file, open it in a text editor like "notepad" (Windows), "kate" or "gedit" (Linux) or "TextEdit" (MacOS), search for the long name and directly edit it in your copy of the GenBank file. If you now upload the modified version of the file, the map generated will display your edited version of the name.
3. Some of the gene names are scrambled after activating the "tidy up" option. Why?
You have probably found a bug in the program.
4. I need a different resolution of the final image. What can I do?
If you are not happy with the offered resolutions you can choose "ps" as output type. This will generate a PostScript file (a scalable vector format) that can be edited (e.g. using Adobe Illustrator, CorelDraw or an open source tool such as Inkscape) and saved in any desired size and resolution.
5. How can I import OGDRAW-generated maps into CorelDraw?
This is actually a quite simple task, if you are using CoralDrawX8 and above. (We cannot comment on earlier versions of CorelDraw). Create a PostScript file ("ps") as output and open it in CorelDraw.
6. I would like to change certain names and/or edit features in the map. How can I do this?
Choose "ps" as output type. This will generate a PostScript file (a scalable vector format) that can be edited (e.g. using Adobe Illustrator, CorelDraw or an open source tool such as Inkscape).
7. Which GenBank tags are used to label drawn features?
OGDRAW tries to extract the names of the features to be drawn from multiple GenBank tags, because annotation amongst published sequences varies a lot. OGDRAW starts to examine the "gene" tag and if empty proceeds via "label", "note", "locus_tag", "product" to "operon". If none of the mentioned tags contains information the respective feature is named "N/A".
8. How are operons identified by OGDRAW?
OGDRAW searches for features of type "prim_transcript" or "operon" spanning other genes. The respective higher order feature will be mapped as polycistronic transcript.
9. I uploaded my favourite plasmid construct to draw a nice map and it looks ugly.
OGDRAW accepts any kind of GenBank file or accession number. However, it was specifically designed and optimized for the drawing of organelle genome maps. If you want a nice map of your plasmid vector you should consider testing tools like PlasMapper or commercial software packages like DNASTAR Lasergene or others.
10. Some gene names seem to be duplicated and/or gene boxes are overlapping or covered with genes classified as "other genes". What's the matter here?
In some cases the annotation contains some "irregularities". For example, some RNA genes can be annotated twice (once as gene and once as RNA product). This might make sense from the author's point of view (and that's why options like "tidy up" are deactivated by default), but it messes up the map. In the example below the following entries in the GenBank file cause a double labelling of trnV and rrn16:
[...]
gene            102440..>102534
                /gene="trnV"
prim_transcript 102440..>102534
 /gene="trnV"
tRNA            102463..102534
                /gene="trnV"
/product="tRNA-Val"
                /note="codon recognized: GUC"
gene            102646..>104252
                /gene="rrn16"
prim_transcript 102646..>104252
                /gene="rrn16"
gene            102762..104252
                /gene="16SrDNA"
rRNA            102762..104252
                /gene="16SrDNA"
                /product="16S ribosomal RNA"
[...]
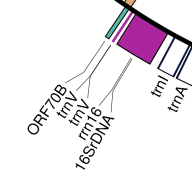
In the case of trnV you can see that it is annotated once as a "gene" with the positions 102440 to 102534 and once as a "tRNA" with the positions 102463 to 102534 (slightly smaller). Since the "gene" trnV is not annotated as tRNA, the program cannot distinguish it from other "other gene"-class genes and therefore draws it in violet. Since the nucleotide positions are slightly different, the two features are also not overlapping completely (in this case, the "gene" would be eliminated by the program). So OGDRAW has no chance to recognize this as a duplication and thus draws both features. In the second case, the situation is even more complicated: The 16S ribosomal RNA gene is annotated 3 times: Twice as a gene with different names and different positions. Once as a rRNA with the same name and position as the second "gene". In this case the second occurrence (i.e. the rRNA) is eliminated by the program because it is at the same position as the preceding one. So what we see on the map are the two overlapping gene features called "rrn16" and "16SrDNA". Our recommendation to solve both problems (trnV and rrn16) would be to download the GenBank file, use a text editor (see answer 2) to delete all the interfering "gene" features leaving only the features with the proper type ("tRNA" and "rRNA") in the file. If you upload this modified version, the output will look as expected.
11. How do I create a custom configuration file?
OGDRAW is designed to map organellar genes. Colors are predefined by the class of the genes, but can also defined them by your choice. Moreover, OGDRAW offers the possibility to define a custom list of feature filters that allow you to define specific custom feature "classes". For each class of features (like "ATP synthase genes") you can define the following properties:
- Feature type (or primary tag - e.g. CDS, mRNA, misc_feature, gene, etc. - for an exhaustive list of types applicable in GenBank entries see this page). The feature type is interpreted as a Perl regular expression.
- The color (as RGB values) the features of this class are to be drawn in.
- A filter pattern for the feature name. This is a Perl regular expression describing the names of the genes that are supposed to fall into the new class.
- The full name of the feature class that will appear in the legend (e.g. "Photosystem II").
- The drawflag that can be set to 1 (meaning "draw this class") or 0 (guess what...).
The custom list can be uploaded as a plain text file of the following XML format:
<!-- OGDraw configuration file -->
  <config>
<feature>
  <color>151,190,13</color>
<fullname>Example class 1</fullname>
<drawflag>1</drawflag>
<pattern>^exa.*</pattern>
<type>gene|CDS|misc_feature</type>
</feature>
<feature>
<color>0,102,44</color>
<fullname>Example class 2</fullname>
<drawflag>1</drawflag>
<pattern>.*</pattern>
<type>gene</type>
</feature>
...
</config>
The above configuration file defines two classes: Class 1 includes all features, whose names start with "exa" (case insensitive!) and that belong to the gene or CDS or misc_feature type. Class 2 includes any gene-type feature, regardless of its name. You can specifiy any number of classes.
The standard template configuration files as implemented in OGDRAW, as well as OGDRAW Config v1.0, an editor to manipulate the XML-config files used by OGDRAW, are available from our download section.
12. All intron-containing genes are fragmented into their exons and the exons are displayed as seperate features on the map. Why is that and how can I solve this problem?
In most GenBank entries, the intron-containing genes are annotated as follows:
- A "gene" feature that encompasses the whole sequence region covered by the gene. This feature is normally continuous. Example:
gene complement(12345..13459)
/note="this is nicely annotated gene"
In some cases, though (e.g. Arabidopsis thaliana mitochondrial genome Y08501) the substructure of the gene is already included in the "gene" tag:
gene join(132071..132213,132214..133176,133177..133245,
133246..134308,134309..134775,134776..135828,
135829..136072,136073..137891,137892..138153)
/gene="nad7"
When OGDRAW encounters a gene annotation like above, it assumes that the gene is trans-spliced, as this annotation style is normally used only for trans-spliced genes (like rps12). Accordingly, the gene will be separated into it's sublocations which will be drawn on the map as discontinuous, independent features. The simplest way to solve this problem would be to download a copy of the affected GenBank entry and manually modify all respective 'gene' features to describe only the start and the end position of the gene:
gene 132071..138153
/gene="nad7"
After introducing the modifications the entry can be uploaded and should display correctly.
13. How do I use OGDRAW for heat maps?
The "Transcript Mode" allows you to map transcript data onto organelle genomes using OGDraw. For this, you need to provide a file containing the transcript (log fold change) data to OGDraw. This file should contain the data in a tab delimited format with the gene identifiers in the first and the expression values in the second column.
OGDRAW supports tab delimited files as data source to create heat maps for organellar genomes:
 psaA	1.78
 rbcL	-3.5
 rpoA	0
Additionally you should provide the genomic information as a GenBank file to map the information on.
Attention: Your gene names in the data file have to exactly match the names in the GenBank file - OGDRAW compares the names and draws only what knows. If you encounter missing genes on your map check the naming in both files first. Genes not mentioned in your data file will not be drawn as well.
Colors for "hot" and "cold" genes can be changed by clicking the colored fields or entering RGB values directly. If you want to compare several heat maps you might want to consider giving them the same scaling.
After you provided your data OGDRAW asks you some questions about the map to draw and finally returns a map which contains your data translated into color code mapped on the organellar genome.
Note: Rather overcrowded legends can be hidden by checking the respective option.